The numbers that keep you in business
Two dashboards answering an owner's real questions: am I making money, and will I run out of cash. Every figure is computed live from the records service companies of 5 to 50 people already keep.
2
dashboards: Overview and Analytics
4
receivables aging buckets
12-month
trends behind the headline numbers
0
numbers entered by hand
Capabilities
A business dashboard for service companies
Two connected views built around the owner's questions: the Overview for cash and profit, the Analytics view for the trends behind them.
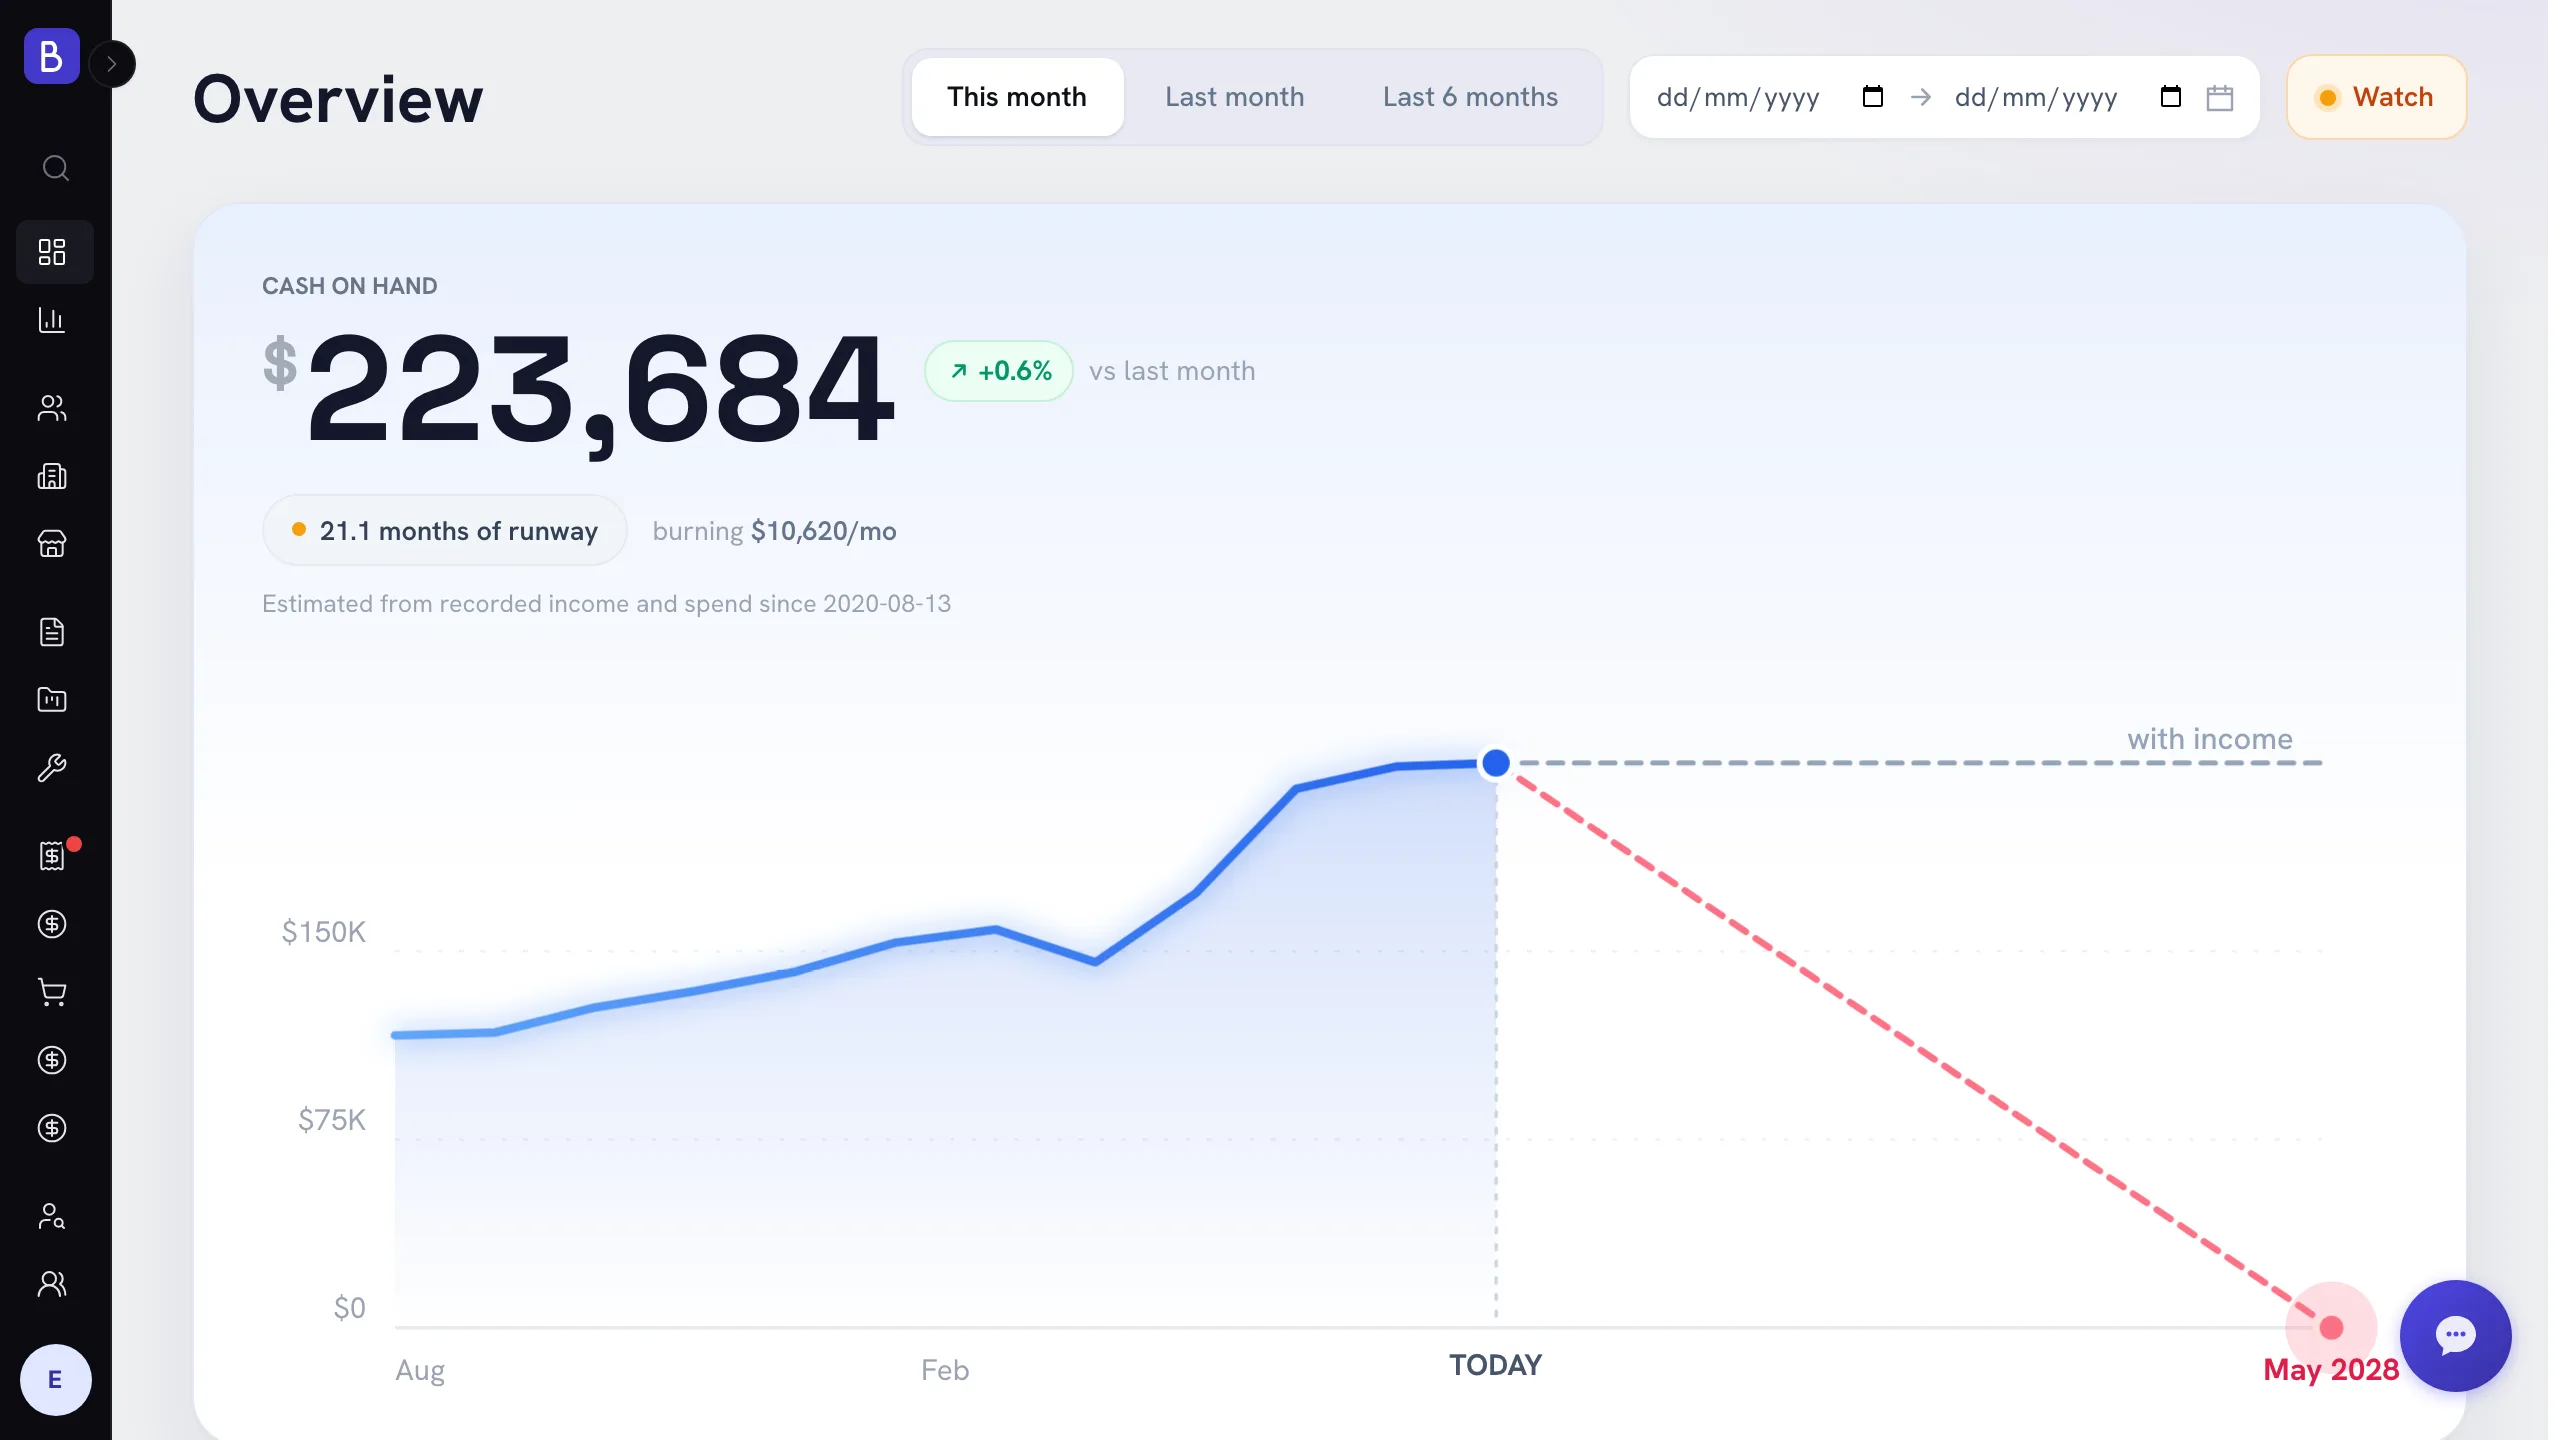
Cash and runway, front and center
The Overview leads with cash on hand, months of runway, and a projection of when cash would run low if income paused. The question that keeps owners up at night, answered on screen.
Money in, money out, profit
Collected income split into recurring and one-off, payroll and purchases going out, and profit with margin, including year to date. The whole picture of whether you are making money.
Receivables that collect faster
Aging buckets for current, 1-30, 31-60, and 60+ days, average days to collect, a collection rate trend, and the clients slowest to pay. See exactly where cash is stuck.
The health of the business
Recurring revenue and its share, proposal win rate, revenue concentration across your top clients, and team utilization, each computed from your actual records rather than a guess.
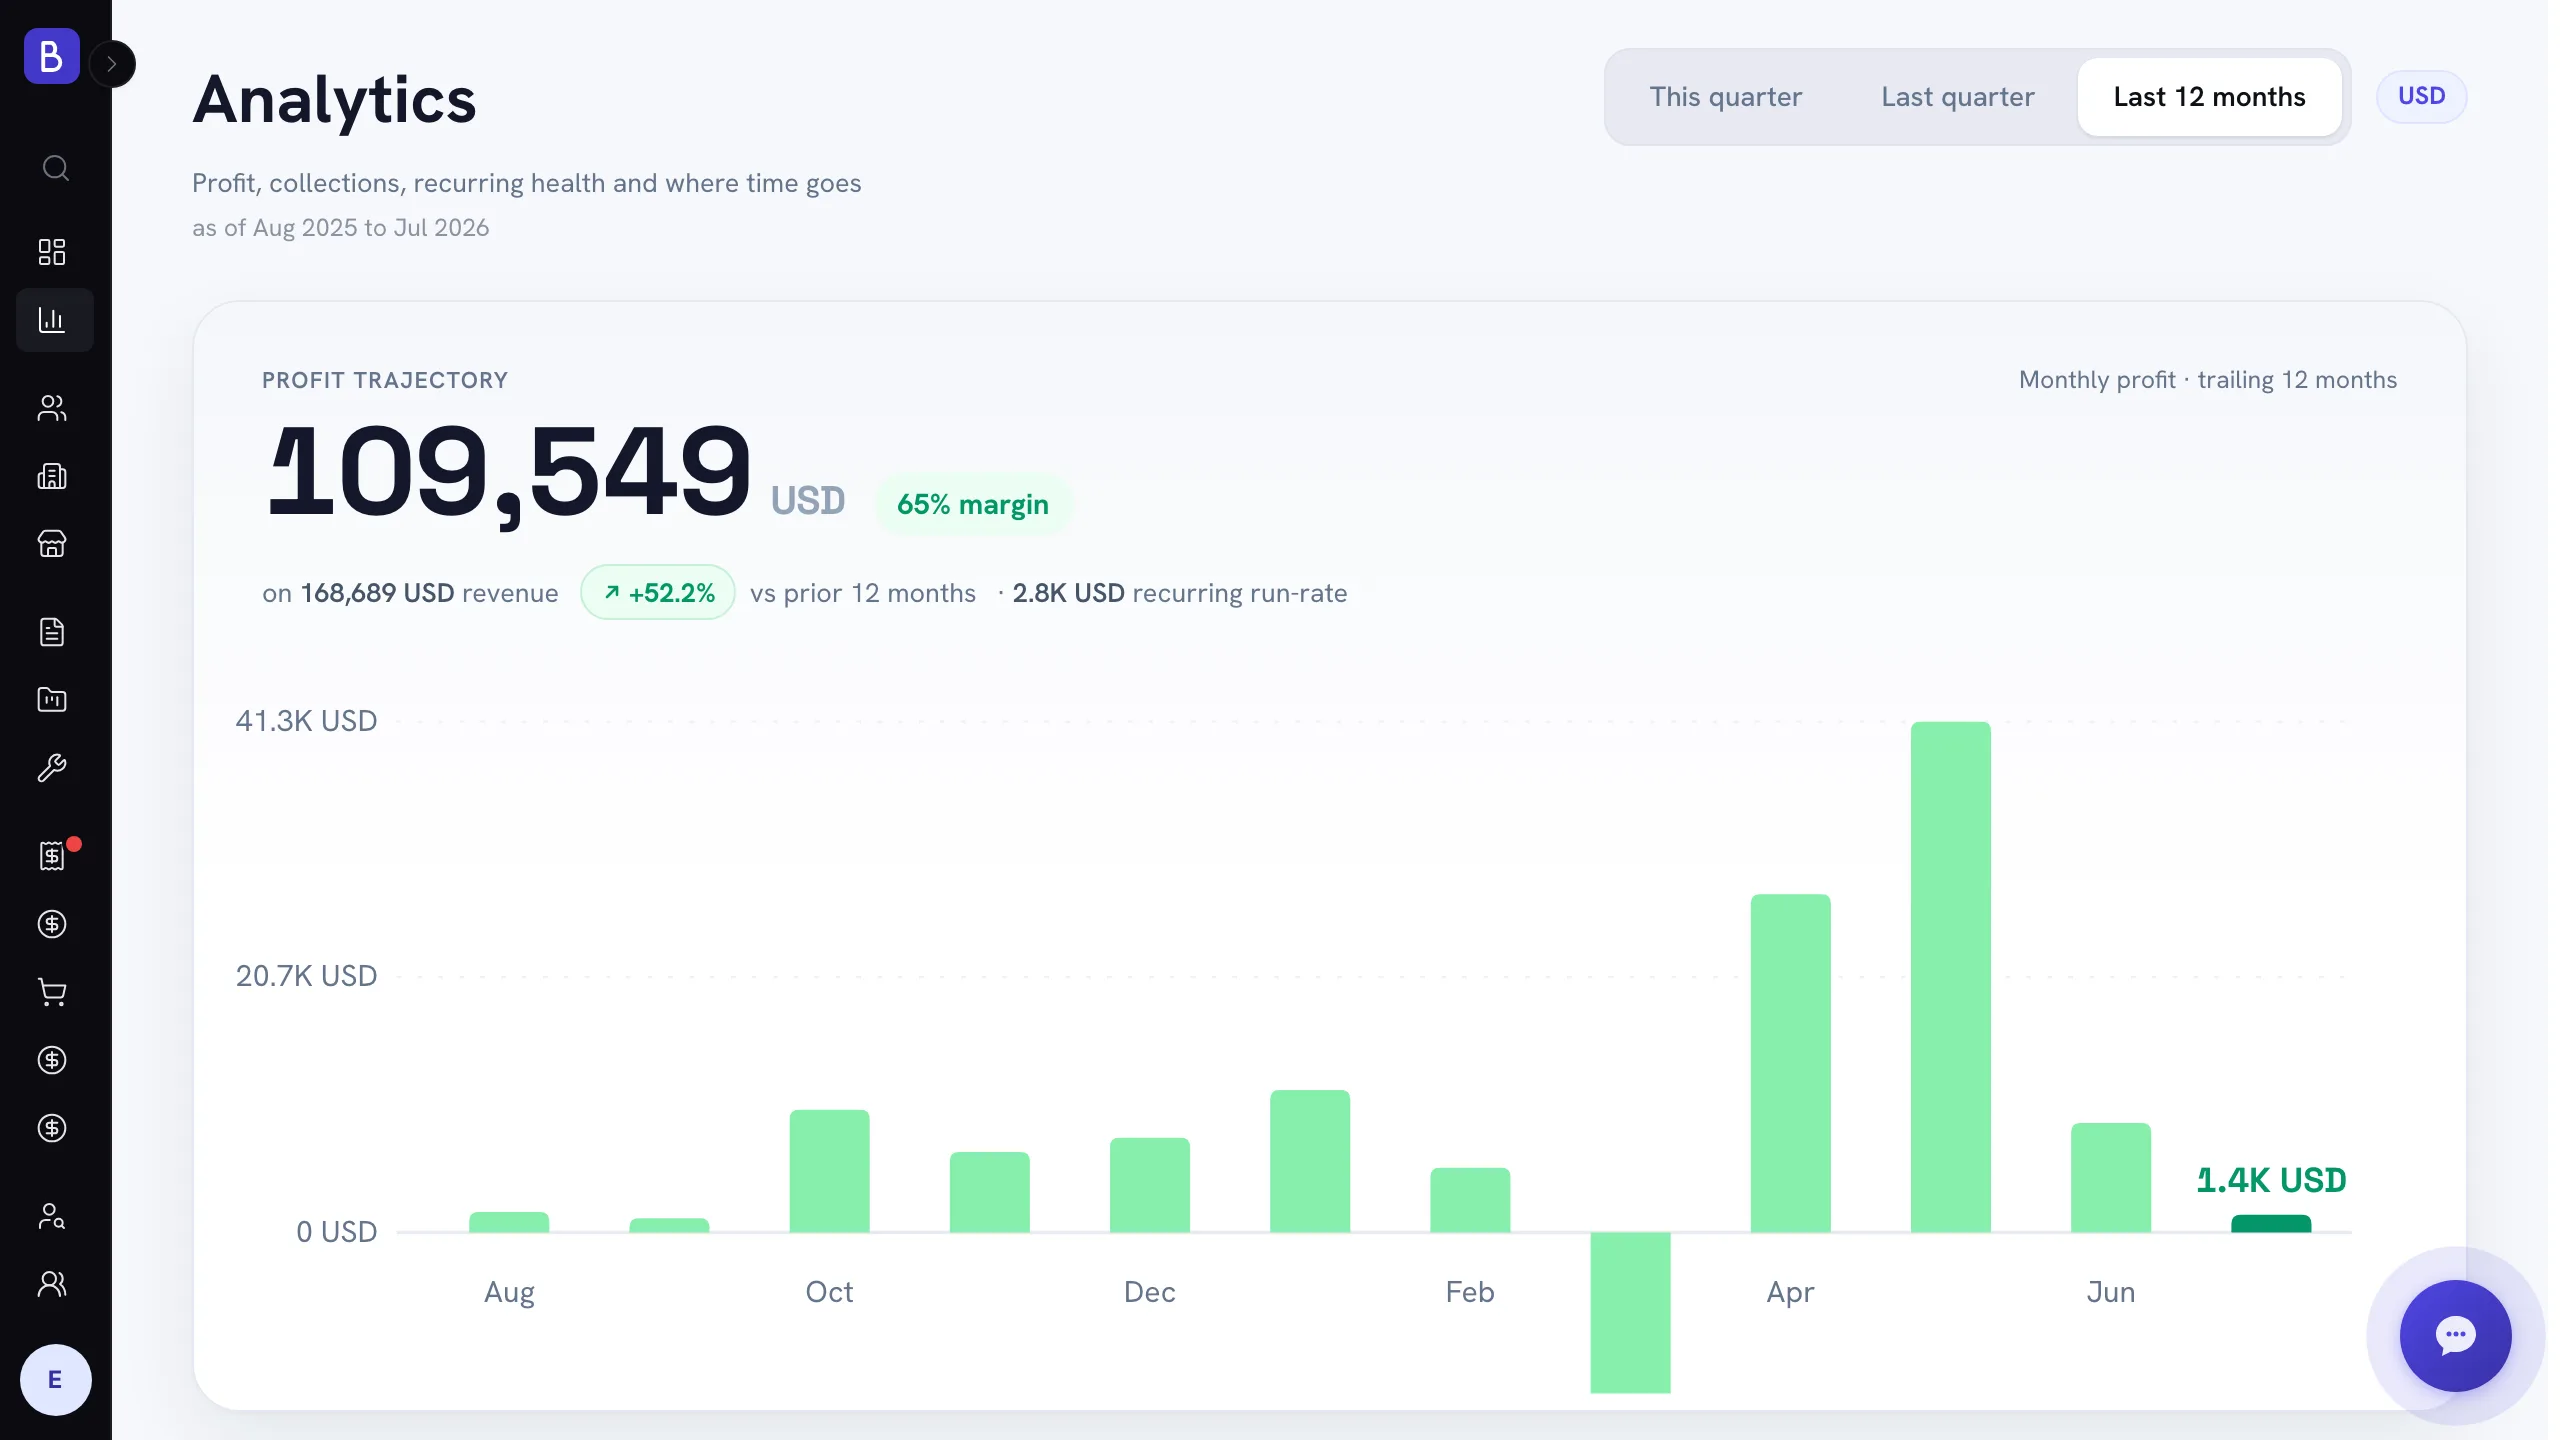
The Analytics view
Trends behind the headline numbers
Where the money comes from, where it goes, and how well you collect, all in one place.
The Analytics view
Trends behind the headline numbers
Where revenue comes from by client and service, where the money goes, collections quality, contracts, and pipeline, all over a 12-month horizon with quarter presets.
- Revenue share by client and by service, with concentration risk
- Days to collect and collection rate over time
- Recurring contracts, pipeline win rate, and utilization
How it works
From daily work to early warnings
01
Run the business as usual
Keep working with projects, invoices, payments, payroll, and contracts. The dashboards read straight from those records.
02
Open Overview
See the cash picture for this month, last month, the last 6 months, or any custom range you choose.
03
Dig into Analytics
Move to 12-month trends on revenue, collections, and pipeline, with this-quarter and last-quarter presets.
04
Act early
Overdue balances, concentration risk, and runway warnings surface before they hurt, so you can move while it is still cheap.
FAQ
Common questions about the Belvak dashboards
Where do the numbers come from?
Every figure is computed live from your invoices, payments, payroll, purchases, and contracts. Nothing is entered by hand, so the dashboards can never drift from your real records.
What does runway mean?
Runway is how many months your cash on hand would last at your current spending if income paused. The Overview also shows the projected month your cash would run low, so the warning arrives early.
Can I control who sees the dashboards?
Yes. Dashboards are permission-gated, so roles without access never see company financials. You decide who gets to view cash, profit, and receivables.
How does it handle multiple currencies?
Figures convert to your default currency for a single, comparable total. If a rate is unavailable, the dashboard says so rather than showing a wrong number, so you are never misled.
What time periods can I view?
The Overview covers this month, last month, the last 6 months, or a custom range. The Analytics view covers this quarter, last quarter, or the trailing 12 months.
Can I export the dashboards?
The dashboards are on-screen views today, not export files. Your underlying data stays yours, and a full data export is available in settings when you need to take it elsewhere.
Keep exploring
What feeds the dashboards
The dashboards do not hold data of their own. They measure the work you already track across the rest of Belvak.
See trouble while it is still cheap
Cash, collections, and profitability computed live from the records you already keep.