Profitability is one calculation you have to actually look at
Project profitability is what a project earns after the cost to deliver it. The formula is plain: take the project revenue, subtract labor cost (the hours each person worked times their loaded hourly cost), then subtract direct costs like contractors and any tools bought just for that job. Divide what is left by revenue and you have the margin. Nothing here needs a finance degree. The hard part is collecting the same inputs for every project and looking at the number while the work is still in progress, not at year end when it is too late to change anything.
Use this if your revenue is growing but you cannot say which projects actually make money and which quietly drain the team.
The project profitability formula, in plain terms
Written out, project profitability is:
Revenue, minus labor cost, minus direct costs, divided by revenue.
Labor cost is the piece most firms get wrong or skip. It is not a share of salary in the abstract; it is hours worked on the project times each person's loaded hourly cost. Direct costs are anything spent specifically for that project: subcontractors, stock assets, a paid tool, travel. Overhead like rent and general software is handled separately (more on that below).
Worked example, using illustrative figures to show the shape: a project bills $30,000. Delivery took 180 hours across the team at a blended loaded cost of about $65 per hour, so labor is roughly $11,700. Add $3,000 in subcontractor cost and direct costs plus labor come to $14,700. Margin is ($30,000 minus $14,700) divided by $30,000, or about 51%. Change one input, say the work drifts to 260 hours, and the same project slides toward 33% margin without anyone noticing in the moment.
How to calculate your loaded hourly cost
You cannot cost a project without knowing what an hour of each person costs you. Loaded hourly cost is more than salary. It is salary, plus payroll taxes and benefits, plus that person's share of overhead. Divide the annual figure by their productive hours per year, which is not 2,080. After holidays, leave, sick days, internal meetings, and admin, a realistic figure is closer to 1,600 to 1,750 hours.
Do not confuse this with billable hours, which is the time a client actually pays for. Loaded cost is what an hour costs you; the billable rate is what you charge for it. The gap between them, across a whole project, is your margin. If you have never run these numbers, the first result is usually a surprise, and usually higher than people expect.
What margin should you aim for
Margin targets are recommendations, not laws, and they vary by service type and market. As a working range, many service firms aim for gross project margins around 30% to 50%. Below roughly 20%, either pricing is too low or scope is leaking, and one bad project absorbs the profit from three good ones. Very high margins can be a signal too, sometimes that you have found a strong niche, sometimes that delivery quality is under-resourced.
Look at the spread, not just the average. A firm at 30% average where every project sits between 25% and 35% is far healthier than one at 30% average where projects swing from a loss to 60%. The second firm has a pricing or scoping problem hidden behind a couple of standout jobs. Fixed-price work with uncontrolled revisions is the most common margin killer, because the hours climb while the price does not.
Why you have to see margin during the project, not after
Revenue is easy to see. An invoice lands in the bank as a concrete number. Cost is diffuse: three people spread across five projects, mixed into payroll, invisible unless you deliberately track it. So a project can feel fine, everyone busy and the client happy, and still be running at a fraction of the planned margin. You only find out at reconciliation, months too late.
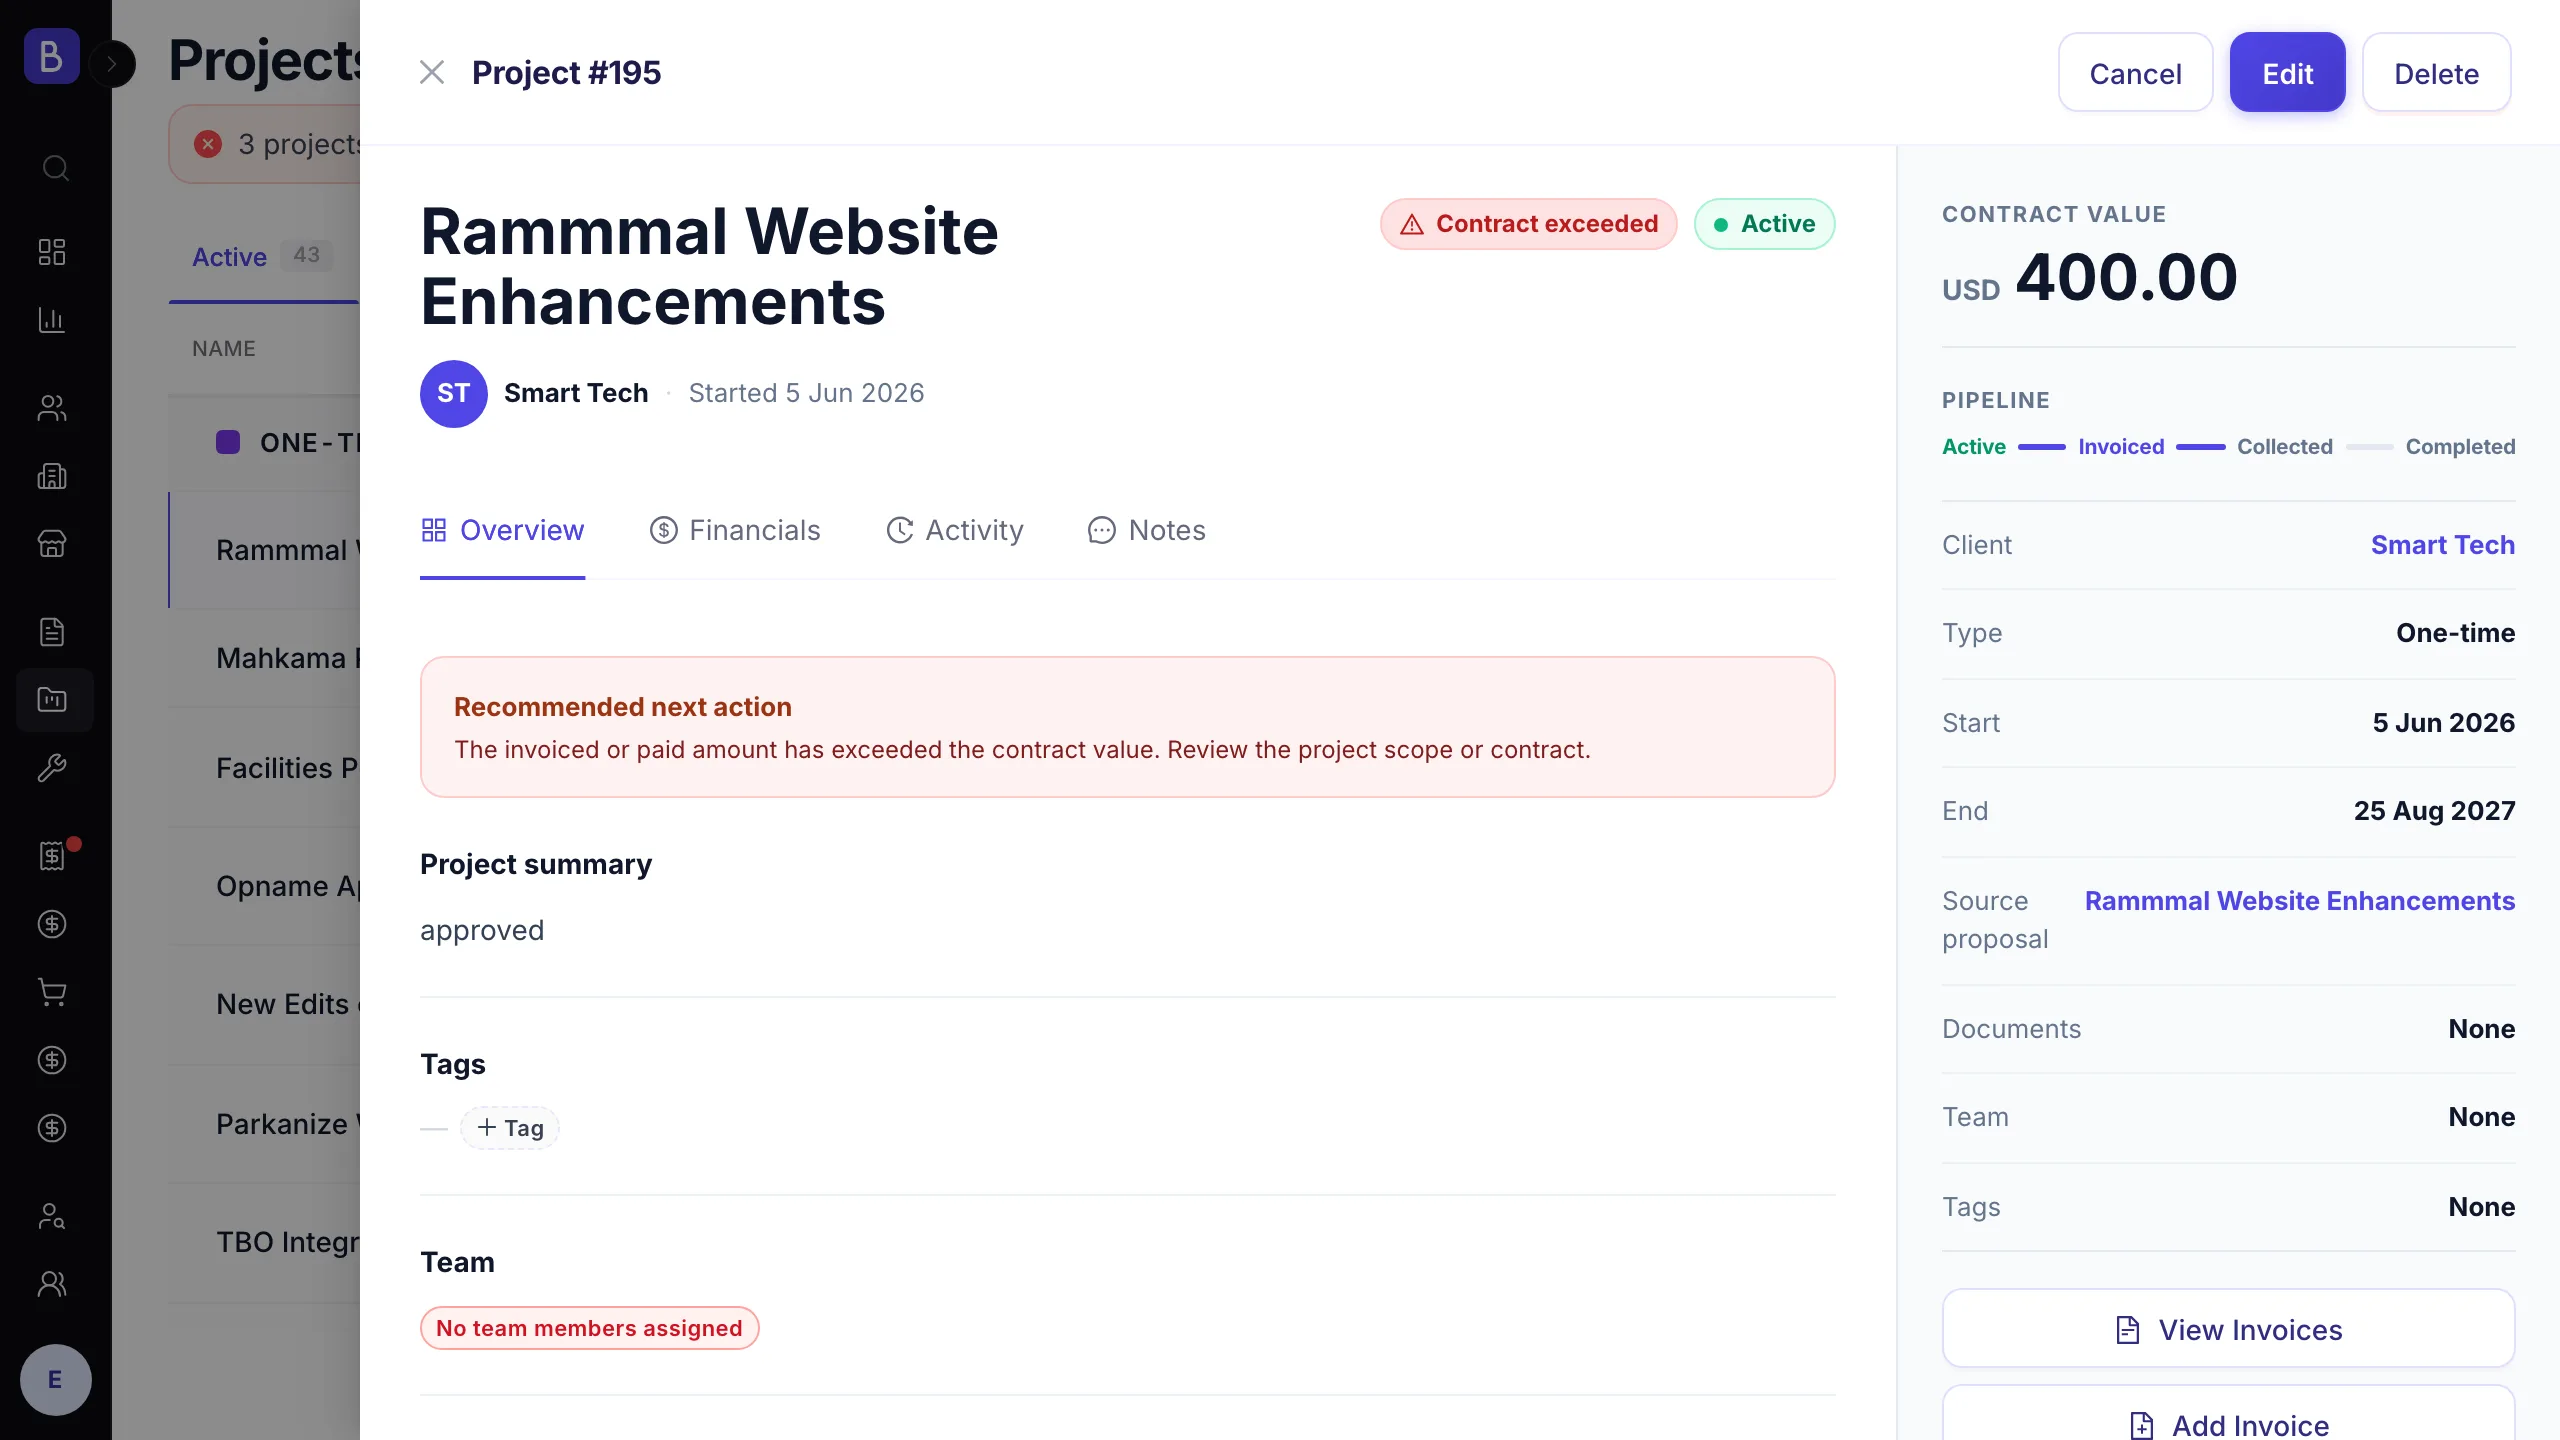
The fix is to track hours at the project level as the work happens and compare cost against revenue at every milestone, not just at close. If a project is burning its budget in the first third, you still have room to adjust scope, staffing, or the conversation with the client. This is where pricing each hour from real pay matters: in Belvak, time tracking values every logged hour using the person's actual pay divided by their expected weekly hours, so project cost and margin are visible while the work is moving rather than assembled afterward. The specific tool matters less than the habit. Whatever you use, the number has to be live.
Red flags that a project is losing money
You can often spot trouble before the numbers confirm it:
- The team is regularly working late on one specific project. Overtime is not dedication; it usually means the job was underscoped or the client is asking for more than was sold.
- A client emails or calls several times a week. High-touch accounts eat hours nobody logs; a couple of thirty-minute "quick calls" each week add up to real unbilled cost over a year.
- A project sits in "almost done" for weeks. The last stretch often takes far longer than expected while no new revenue comes in.
- Nobody can cleanly say what is in scope and what is not. Vague scope always favors the client, because you do the work to keep the relationship and never bill for it.
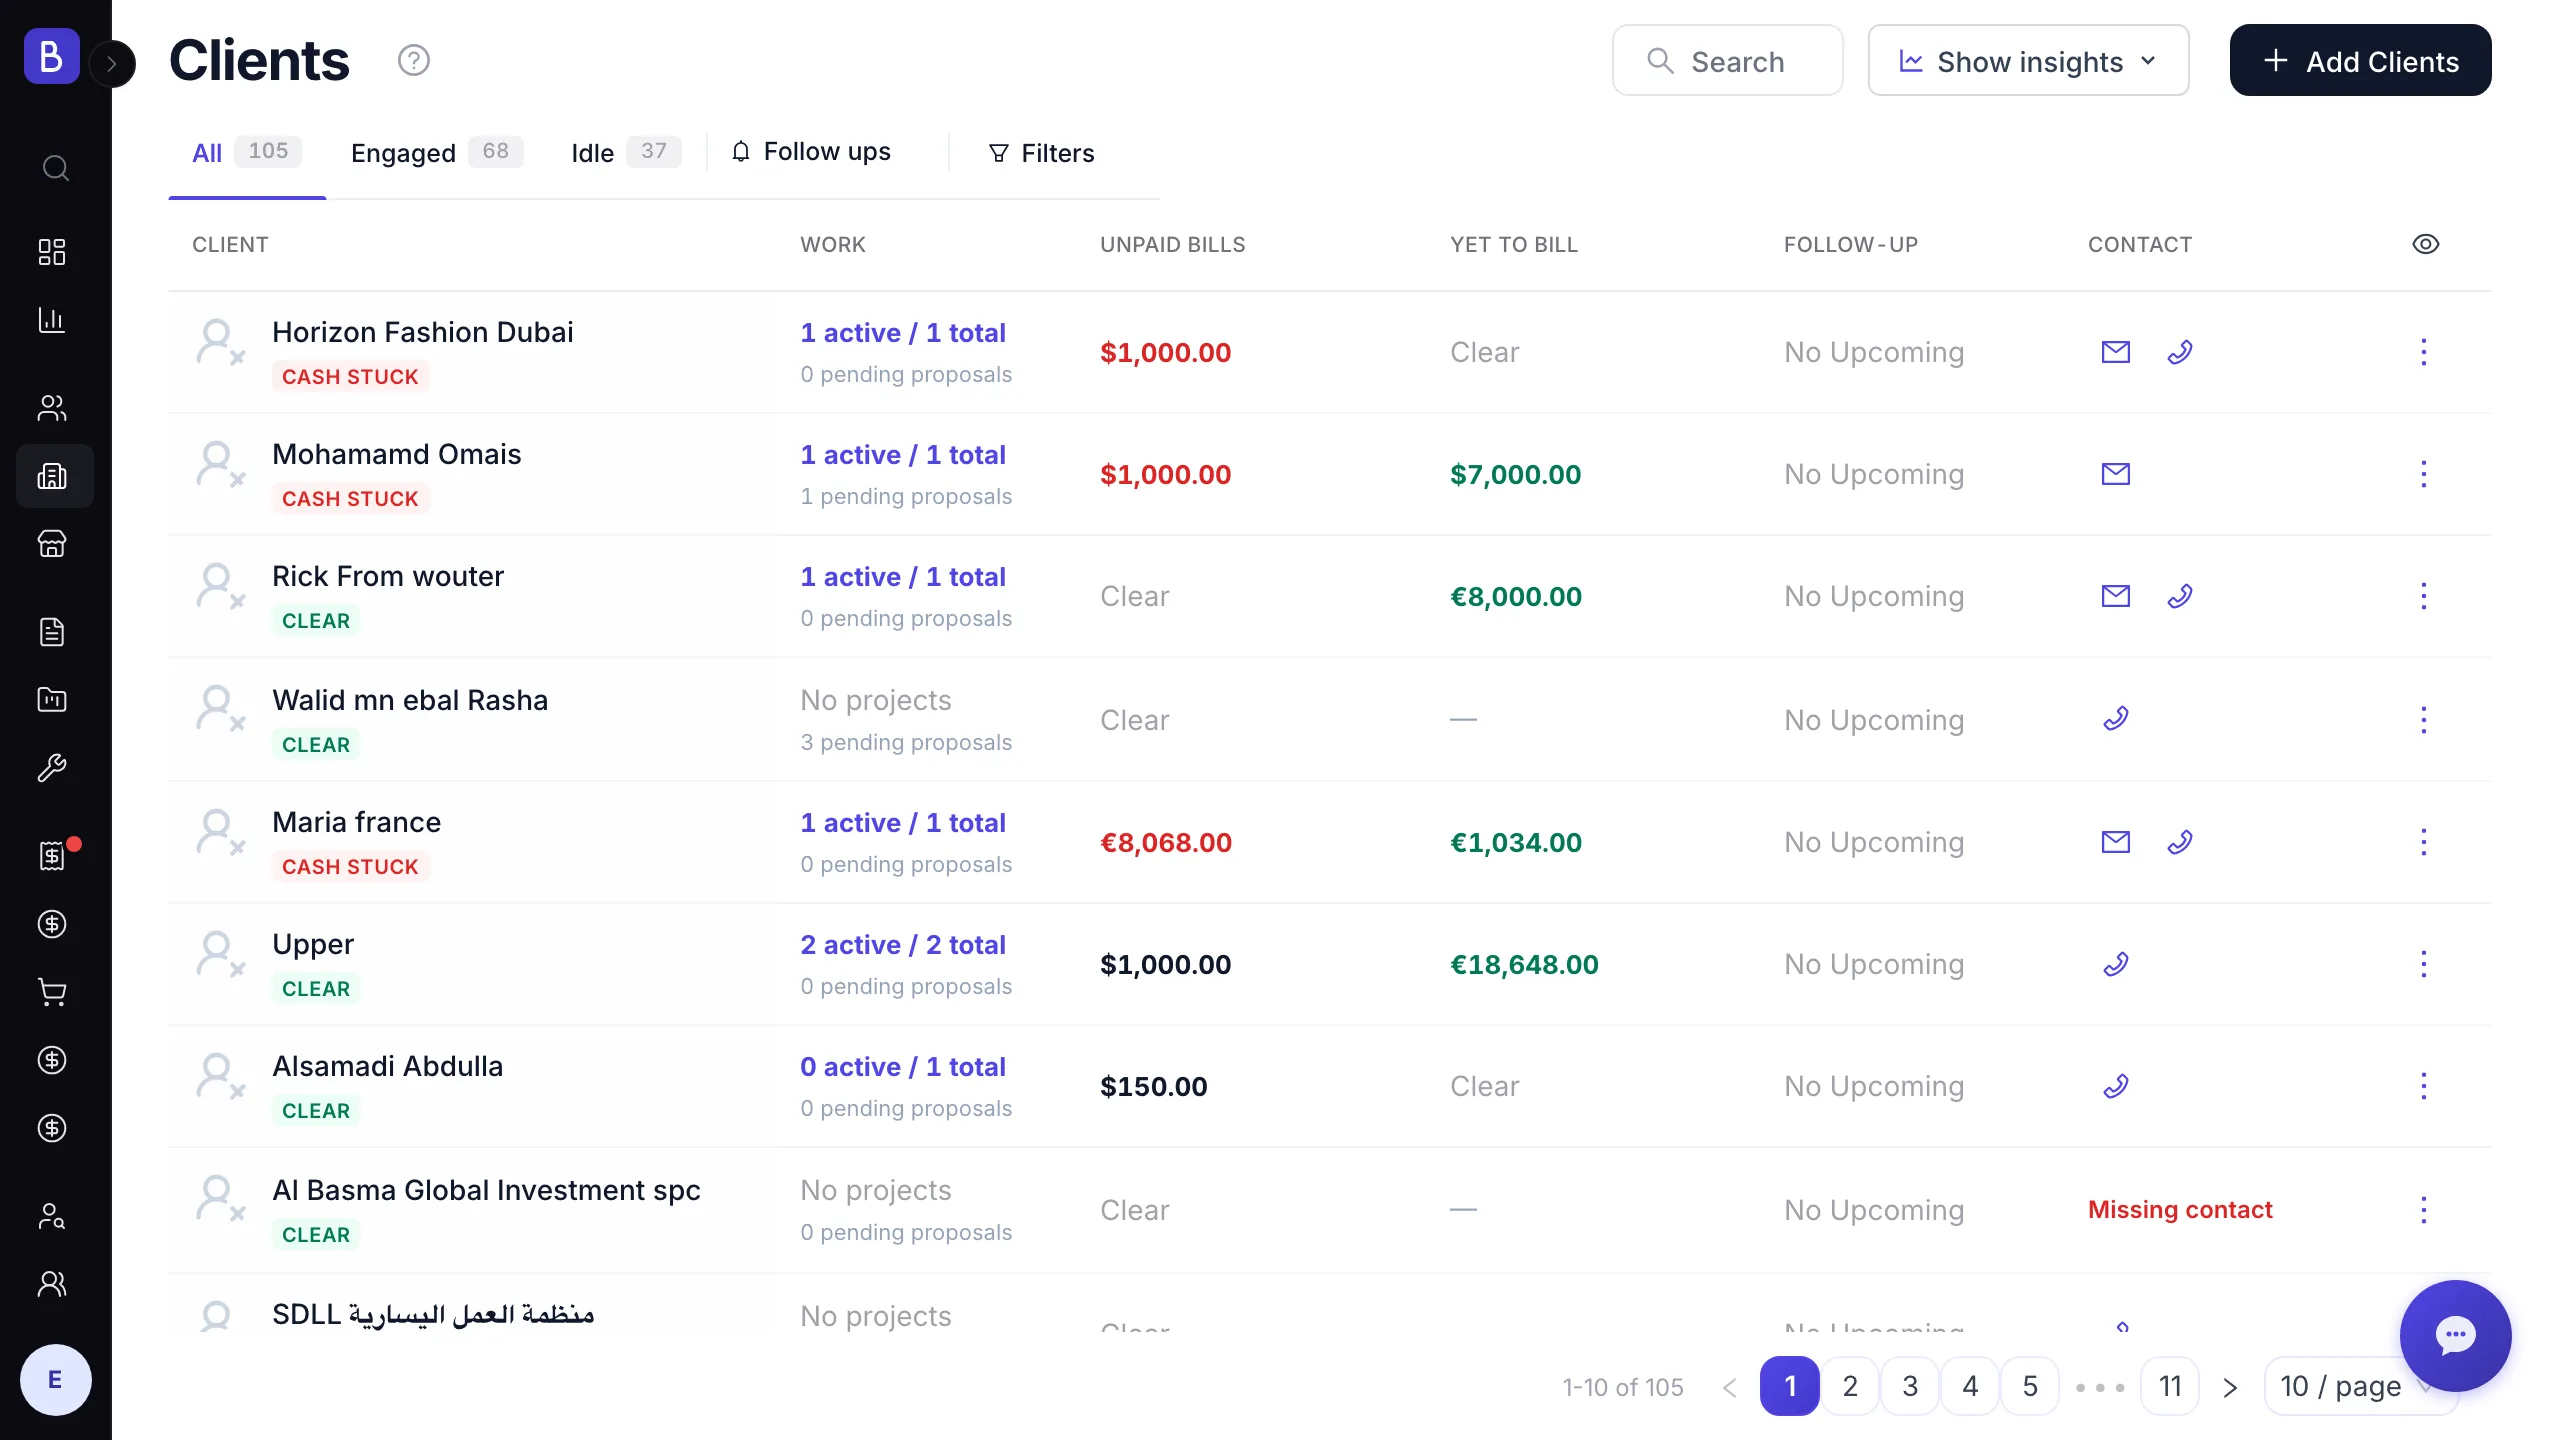
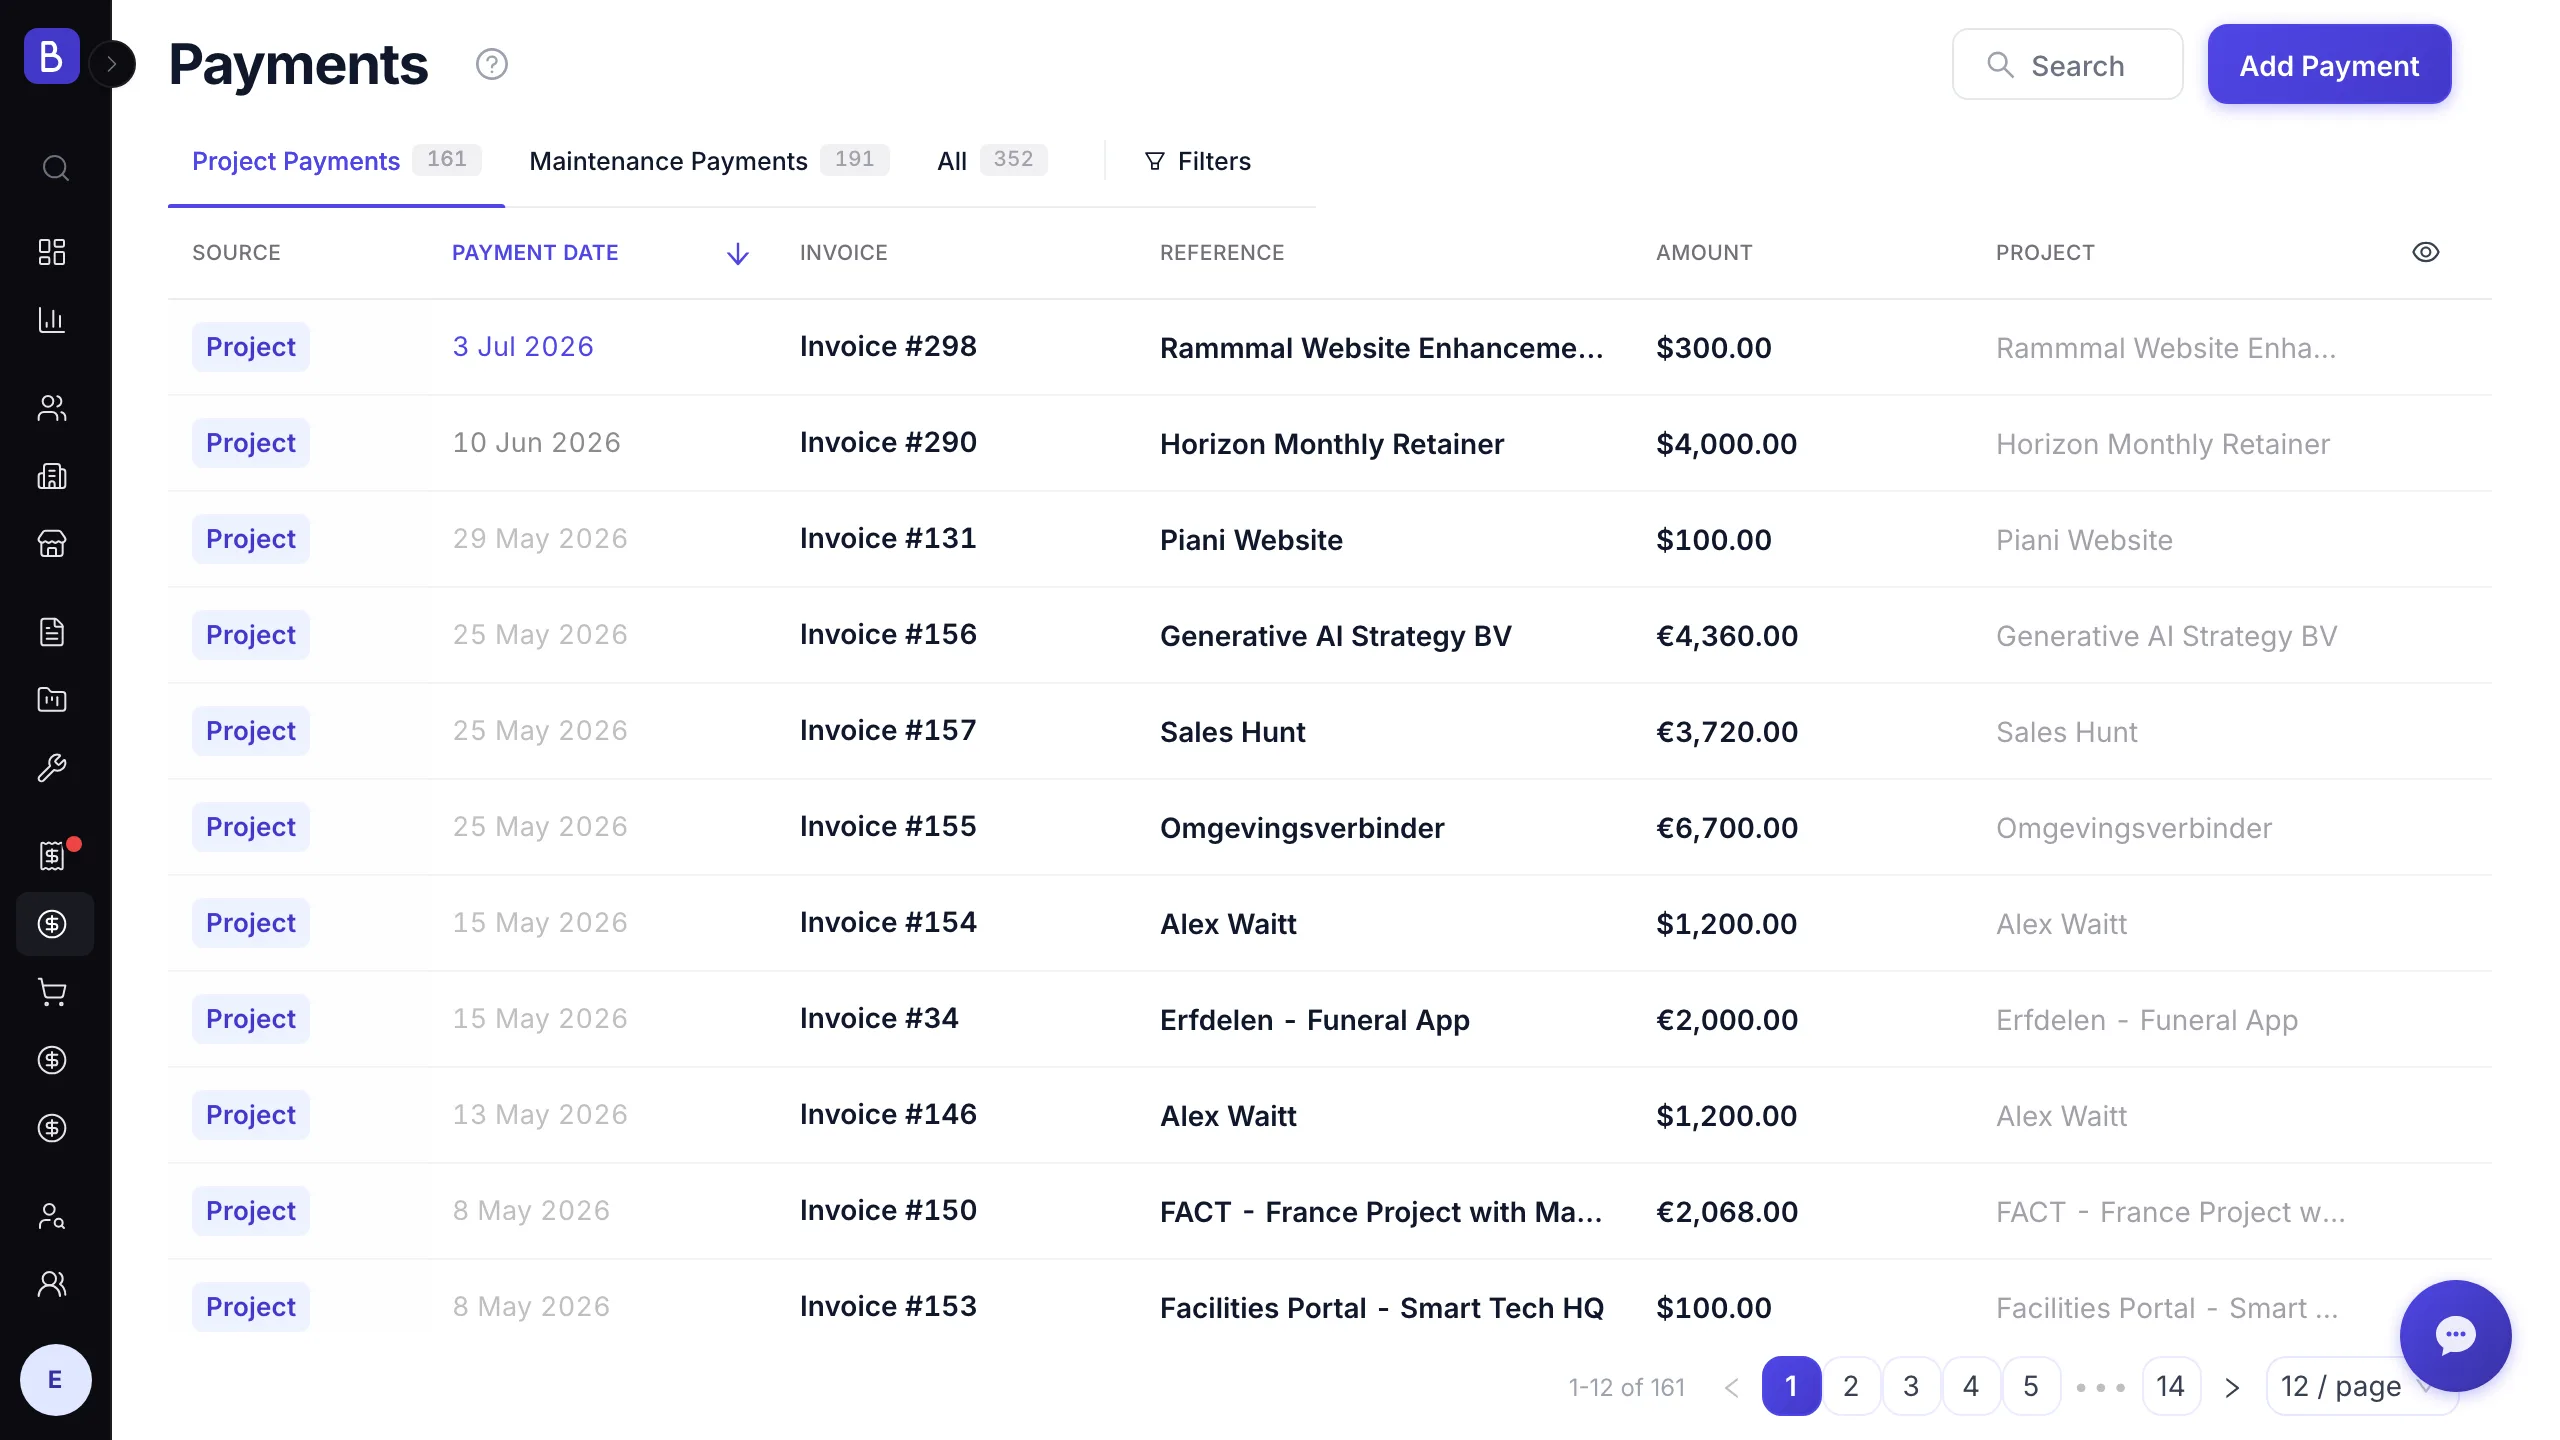
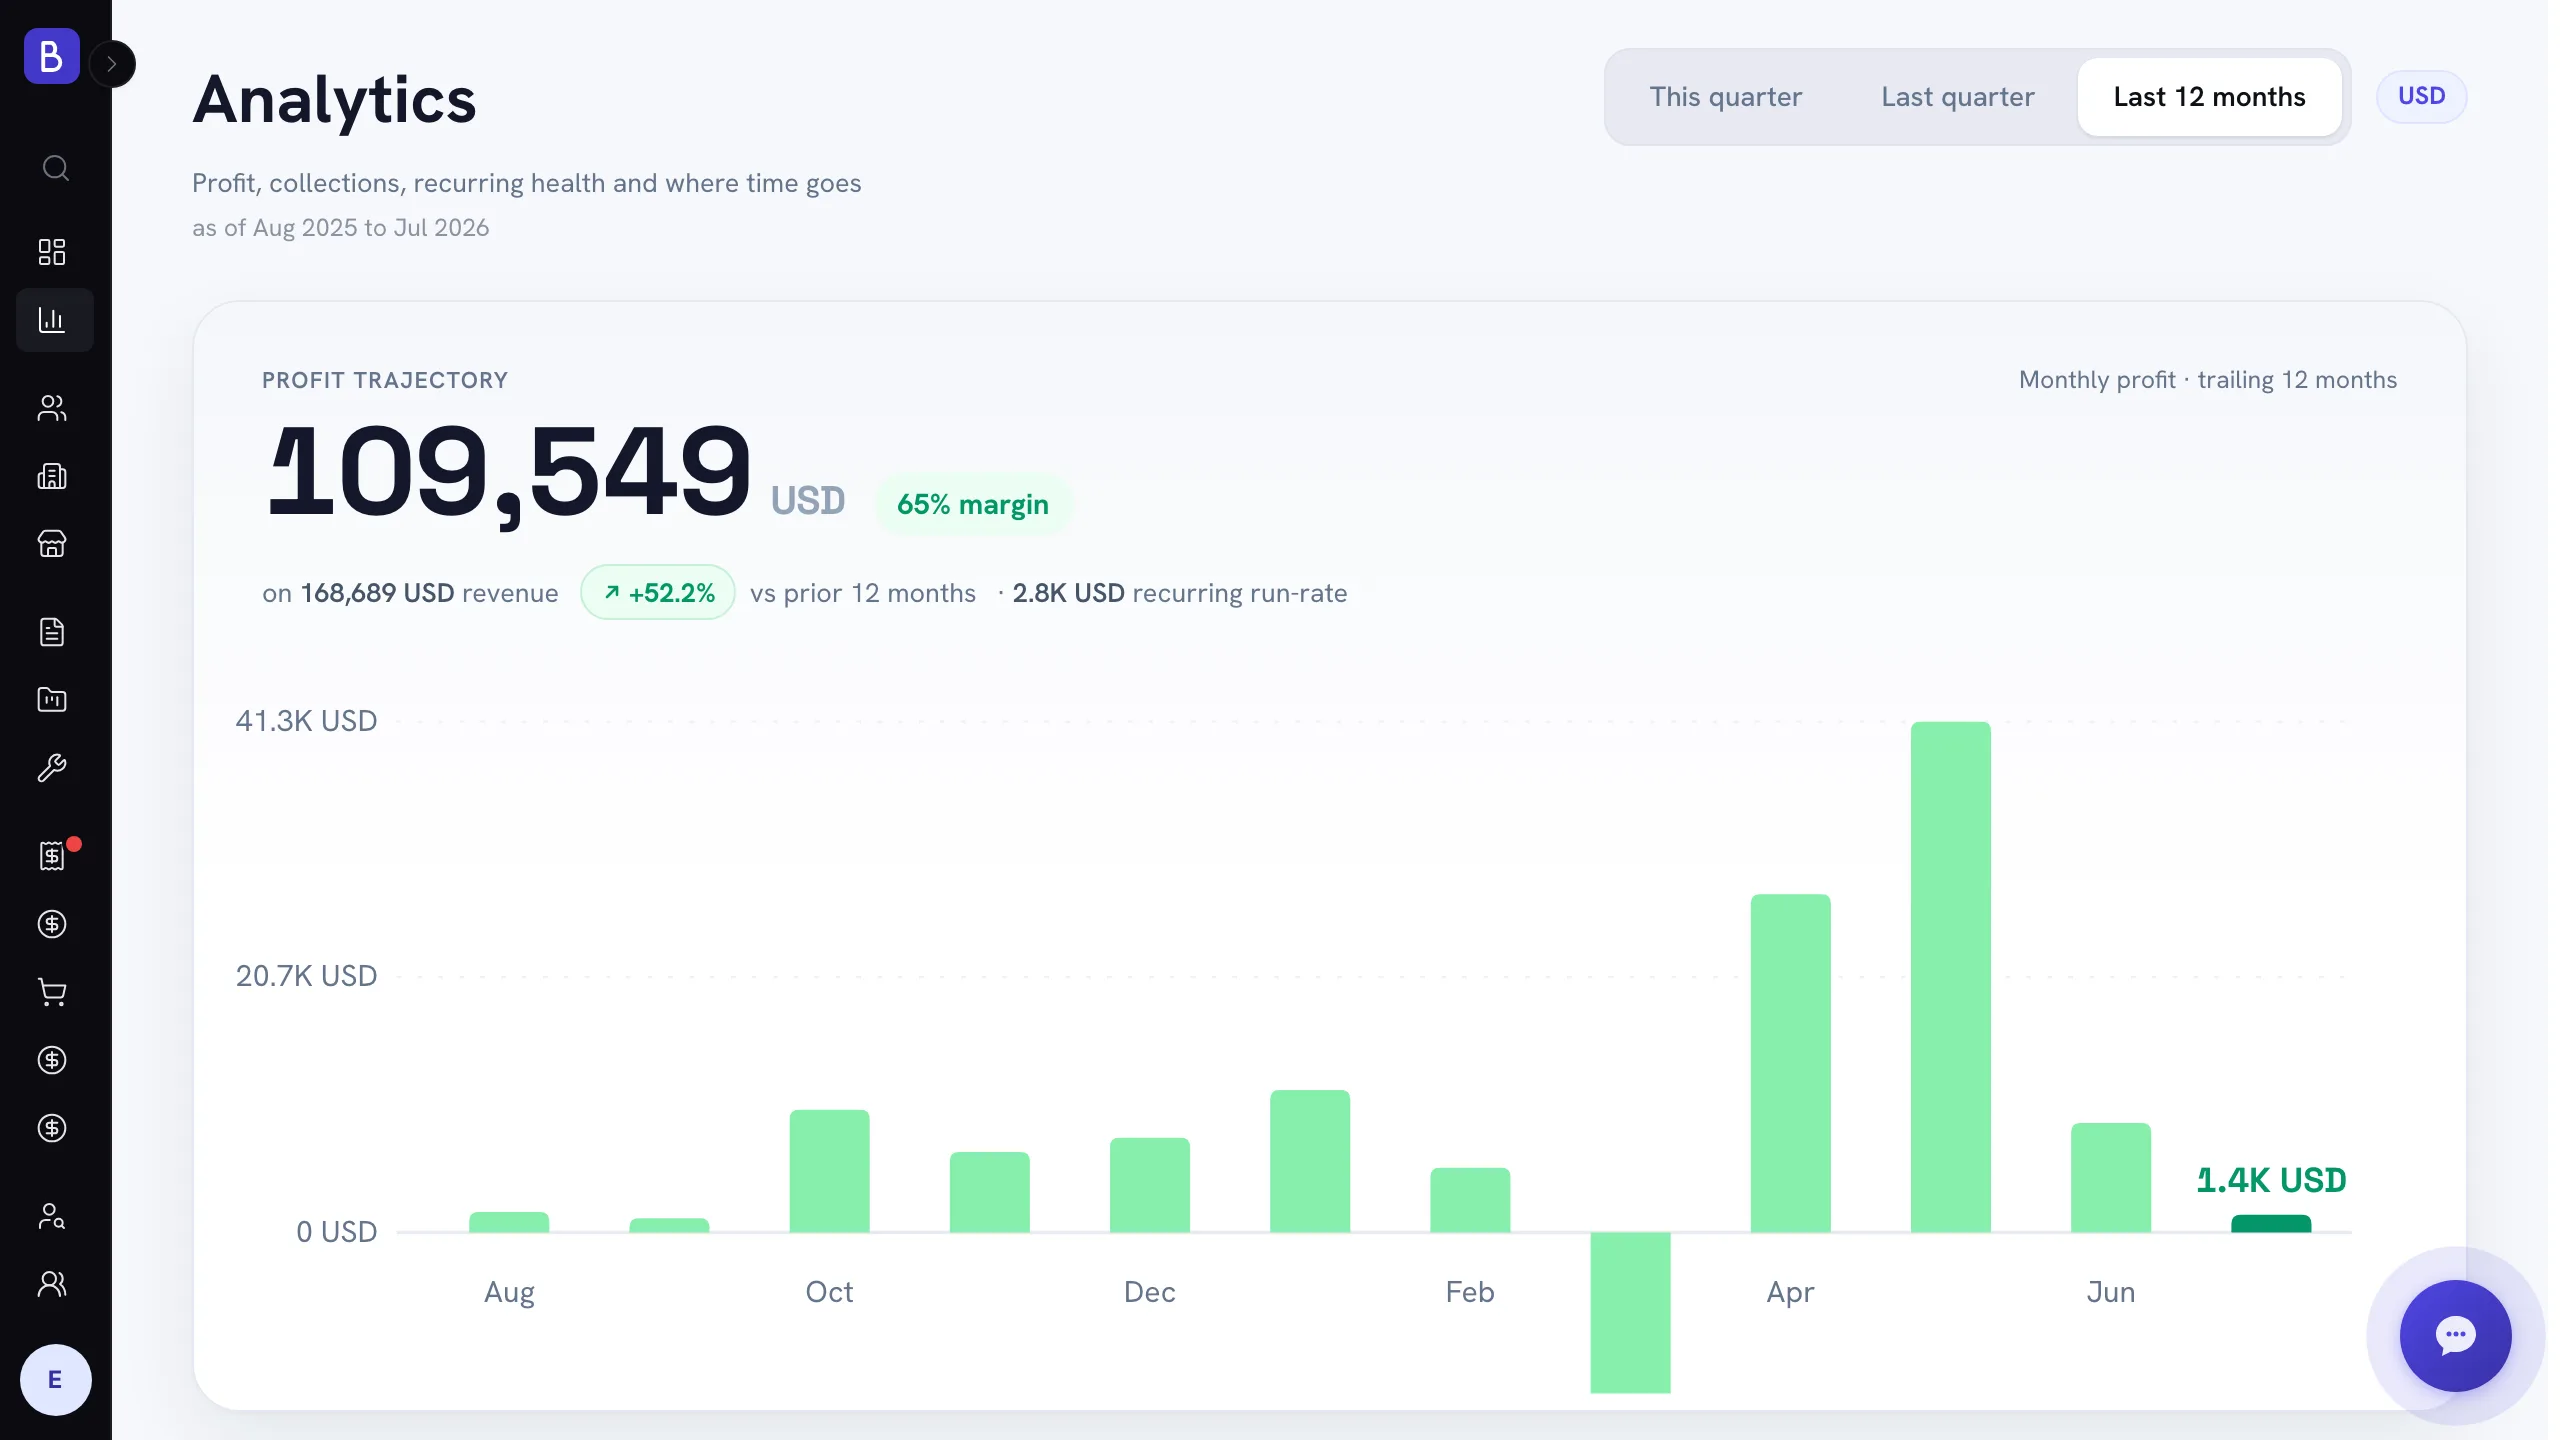
Keeping cost and margin next to project status, invoices, and payments makes these visible early. An analytics view that shows profit and margin alongside the work turns a monthly surprise into a weekly glance.
Keep overhead allocation simple
Do not build an elaborate model that distributes rent by desk and software by seat. Sum your monthly overhead (rent, utilities, general subscriptions, insurance, accounting), divide by total delivered hours across the firm, and add that per-hour figure to each person's cost. It is not perfectly precise, and that is fine. A rough number the team reviews every month is far more useful than a perfect model nobody maintains. Precision you ignore is worse than an estimate you act on.
If you do not currently know which projects are profitable, start now, even roughly. Project name, revenue this month, hours logged, cost per person, margin. You may not like the first result, but every month spent flying blind is a month an unprofitable project drains the business while the revenue number smiles back at you.